12.7 MassTools - Plug-in for mass spectrometry
12.7.1 Introduction
This plug-in was developed as interface to simplify the use of the VEGA ZZ database engine in mass spectrometry research fields in which it's a common practice to submit the experimental monoisotopic masses as database queries to identify molecules.
12.7.2 Installation
The MassTools plug-in isn't included in the standard VEGA ZZ package and it's provided as separated setup. It must be installed after VEGA ZZ setup and includes the plug-in and a test database containing 6850 molecules (flavonoids) collected by M. Arita et al.
12.7.3 Usage
To start the plug-in, you must select Tools
![]() Mass spectrometry tool
in VEGA ZZ main menu:
Mass spectrometry tool
in VEGA ZZ main menu:
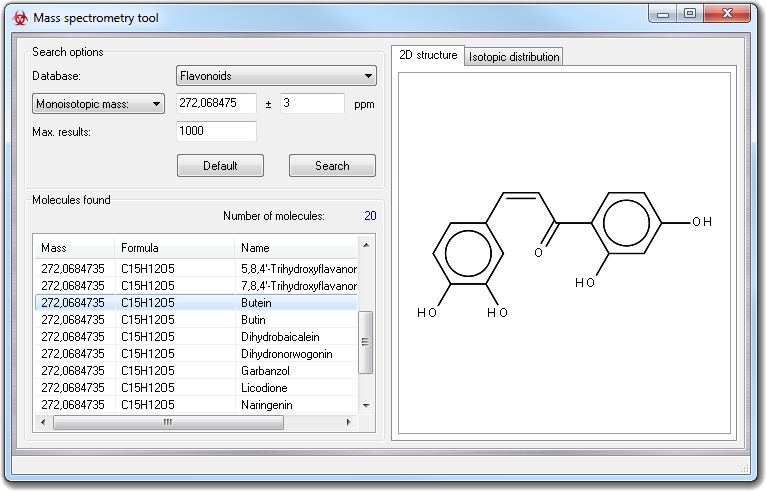
This interface allows to submit queries to a specific database (Database
field in the Search options box) including the Monoisotopic mass
and the isotopic confidence range (ppm). The query results, obtained
clicking Search button, are retrieved in Molecules found
box showing monoisotopic masses, formulas and molecule names. The maximum number
of molecules of the report can be limited by Max. results value. When you
click a molecule in the list, its 2D structure is automatically shown in 2D
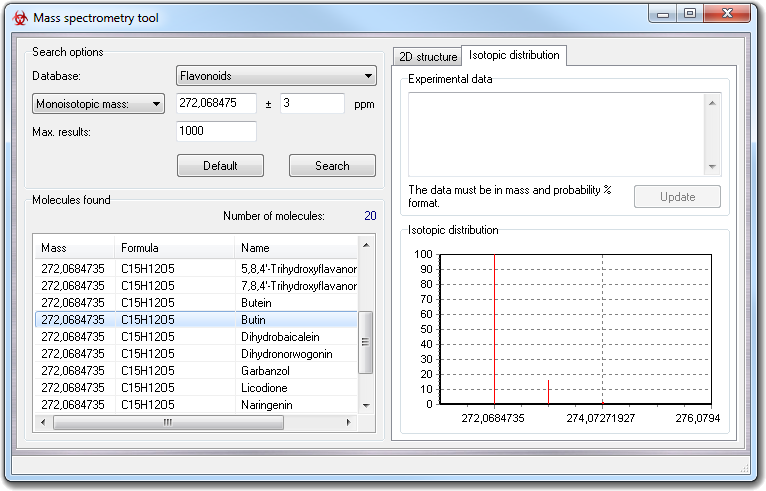
structure tab. Double
clicking on each item in the report, you can visualize the isotopic distribution.
Moreover, right-clicking each result item, you can show the context menu in which you can choose:
| Menu item | Description |
| Show structure | Show the 3D structure in VEGA ZZ main window. It's equivalent to double click on the molecule line. |
| Isotopic distribution | Show the isotopic distribution in the Isotopic distribution box. |
| Save as ... | Save the report to a file that can be in CSV (Comma Separated Values) or DIF (Data Interchange Format) format. Both formats can be opened by Microsoft Excel and include the Mass, Formula and Name fields. |
| Copy | Copy the value under the mouse pointer to the clipboard. |
| Copy row | Copy the whole data (Mass, Formula and Name together) included in the currently selected line to the clipboard. The fields are separated by space characters. |
| Copy all | Copy the entire report to the clipboard using the CSV format. |
| Send to Excel | Send the report to Microsoft Excel using the DDE connection. |
The Isotopic distribution chart has an own context menu as explained in the following table:
| Menu Item | Menu subitem | Description |
| Edit | Copy chart | Copy the chart to the clipboard. |
| Copy data | Copy the data used to build the chart (isotopic masses and relative abundances) to the clipboard. The data is line formatted: each line contains mass and % abundance separated by a single space character. | |
| Send to exp. | Send the data to the Experimental data box to compare the isotopic distribution with that of another molecule. | |
| Zoom | In | Zoom in the chart |
| Out | Zoom out the chart. | |
| Reset | Revert the zoom factor to the starting value. | |
| - | Do a hard copy of the current chart. |
The chart zoom factor can be controlled by the mouse, keeping pressed the left button and defining a rectangle over the area to zoom in. To zoom out or to revert to the starting zoom factor, you can use the suitable functions of the context menu.
To compare the isotopic distribution of a molecule in the database with that obtained experimentally, you must paste the experimental data in Experimental data box in mass-abundance format (each number must be separated by space or carriage return character) and click Update button. In the chart are shown both isotopic distribution at the same time (red for the database molecule and blue for the experimental data). The Rms value, shown in the chart, summarizes how the two isotopic distributions are similar: lowest values mean similar distributions and zero means the same distribution.
Clicking Default button, all fields in the form are set to the default values.