12.15 RamaPlot - Ramachandran Plot
12.15.1 Introduction
G. N. Ramachandran used computer models of small polypeptides to systematically vary Phi and Psi torsion angles with the aim to find stable conformations. For each conformation, the structure was examined for close contacts between atoms. Atoms were treated as rigid spheres with dimensions corresponding to their Van der Waals radii. Therefore, Phi and Psi angles which cause spheres to collide correspond to sterically disallowed conformations of the polypeptide backbone.
12.15.2 Usage
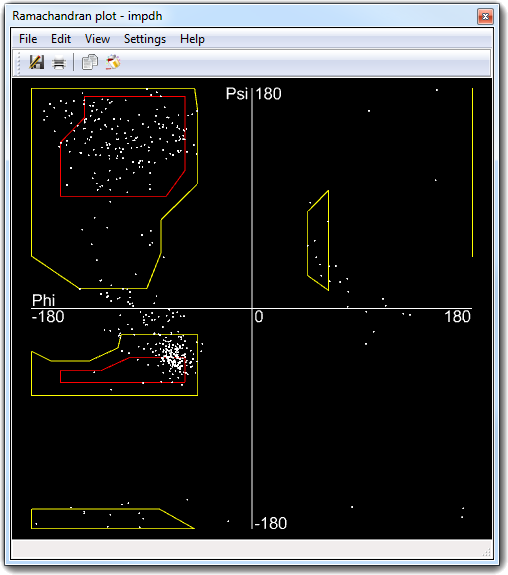
RamaPlot plug-in allows to calculate
Phi and Psi torsion angles of the protein backbone and to show their values in a two dimensional
plot. To open the Ramachandran plot window, you must open a protein structure
and select Calculate
![]() Ramachandran plot in main menu:
Ramachandran plot in main menu:
You can use the mouse to explore the plot: press
the left button and move the mouse to translate the plot area, click the points
by the left button to enlarge the view, click the points by the right button
to reduce the view and use the mouse wheel to zoom the plot area.
Other controls are accessible by the keyboard: use the arrow keys to translate
the plot area and press the space bar to revert to the default view.
12.14.3 The main menu
| Menu | Item | Subitem | Accelerator | Description |
| File | Save As ... | Ctrl+S | Save the plot. The supported file formats are: Bitmap, Comma Separated Values (CSV), JPEG, Encapsulated PostScript, LaTex, PCX, PDF, PNG, PPM, PostScript, Raw bitmap, Silicon Graphics (SGI), SVG standard, SVG for the Web, Targa, TIFF, VRML 2.0 and VRML 2.0 packed. |
|
| Ctrl+P |
Print the plot. |
|||
| Exit | Ctrl+E | Close the Ramachandran plot window. | ||
| Edit | Color molecule | - |
Color the molecule from witch the plot was generated using the corresponding color of the area in witch each residue is contained. |
|
| Copy | Ctrl+C |
Copy the plot in the clipboard using the bitmap format. |
||
| View | Labels | None | - |
Enable/disable the residue labels for each Phi/Psi pair of values. |
| Residue | - | |||
| Residue name | - | |||
| Residue number | - | |||
| Zoom | Reset | F1 | Change the scale factor. | |
| 200 % | F2 | |||
| 300 % | F3 | |||
| 400 % | F4 | |||
| Visible residues | - |
Show the Phi/Psi values of the active/visible residues only. You can change the active/visible residues by using the selection tools provided by VEGA ZZ main window. In this way, you can reduce the number of points/labels in the plot area, clarifying the view. |
||
| Settings | Colors | Background | - |
Change the background color (default: black). |
| Inner area | - |
Change the inner area color (default: red). |
||
| Outer area | - |
Change the outer area color (default: yellow). |
||
| Axis | - |
Change the color of the axis (default: white). |
||
| Labels | - |
Change the color of the labels (default: white). |
||
| Points | - |
Change the color of the points (default: white). |
||
| Fonts | Big | - |
Change the font size of the labels (default: Medium). |
|
| Medium | - | |||
| Small | - | |||
| Smallest | - | |||
| Points | Big | - |
Change the point size (default: Small). |
|
| Medium | - | |||
| Small | - | |||
| Smallest | - | |||
| Filled areas | - |
Enable/disable the filled areas. |
||
| Presets | Default | - |
Revert to default settings. |
|
| Last saved | - |
Revert to last saved settings. |
||
| Printer color | - |
Load the color printer profile. |
||
| Printer B&W | - | Load the B&W printer profile. | ||
| Save | - |
Save the current settings. |
||
| Help | Content | Ctrl+H |
Show this document. |
|
| About | - |
Show the copyright message. |
12.15.4 Output examples
VRML 2.0
Recommended viewers: Cortona
3D Viewer or Cosmo Player
SVG for the Web
Recommended viewer: Adobe
SVG Viewer
Standard SVG output