| 5.4 Graph Editor |
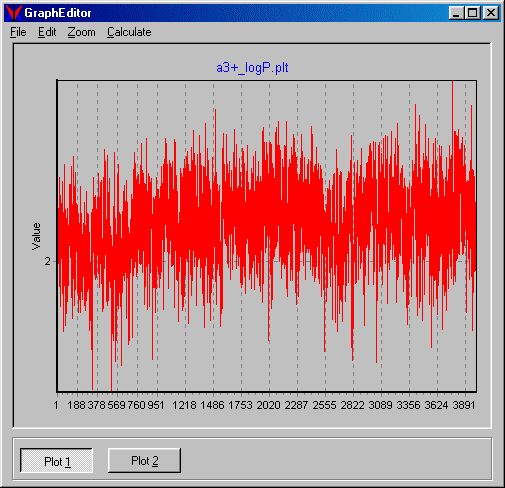
The Graph Editor allows to show and to manage data sets calculated by VEGA and/or by other external programs. It's possible to load the data in some file formats in order to support the largest number of packages. All functions are available through the menu bar and the mouse operation.

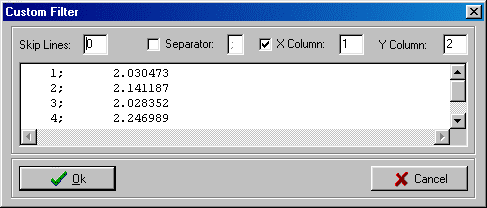
The supported file formats are: CHARMm Energy (.ene), Comma Separated Values (.csv), Quanta (.plt) and custom. If your data set format is not directly supported, you can use the following custom filter:

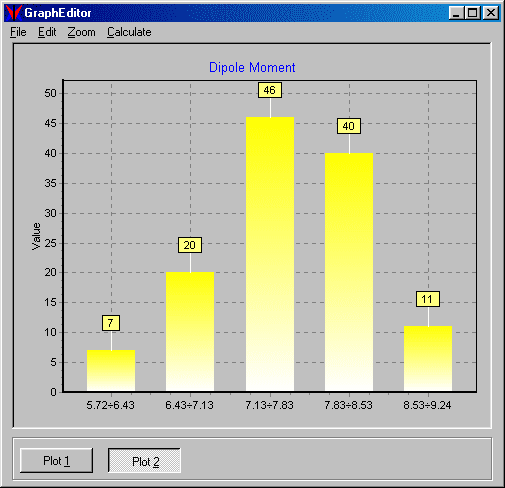
The Graph Editor have also powerful functions to cluster the data, defining the number or the ranges of the clusters.

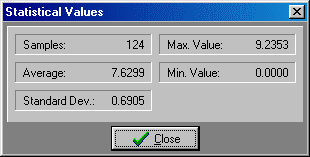
Finally the Graph Editor can show a dialog box with some statistical values related to the data set.

| 6.
Conclusions |